I’m Greg Phelps, the president of Red Rock wealth management. I want to thank you for your time and for letting me be a small part of your life as your financial advisor. I know that this is a very timely subject and that’s evidenced by all the people on the webinar today with such short notice (less than 24 hours).
There are quite a few people who have decided to join us today, and hopefully look at this as setting a framework for where are we really at with the stock markets. Is there anything that we should be doing investment-wise? Are there things that we shouldn’t be doing investment-wise?
In the big picture, how does this kind of volatility we’ve seen recently fit within the history of the stock market? How do recent market downturns this year fit in the context of your investment plan and your retirement plan?
Finally, I want to let you know that you’re not alone as evidenced by all the people on this webinar. Many investors are having the same sort of anxiety and frustrations and fears that you do in this crummy stock market!
I totally understand the anxiety. Hopefully, some of this information will quell those fears and put your nerves at ease a little bit.
So you’re not alone. It’s a very normal reaction. You know, even the most educated of us within the financial markets—we also have the same fear sometimes as well! So so don’t feel like you’re abnormal or unusual at all.
Just how bad IS the stock market right now?
Let’s take a look at the actual state of the stock market. Where are we in the context of where we’ve been? I pulled a chart here the S&P 500 going back five years. As you can see we’ve had a couple of high points in the last 12 months or so.
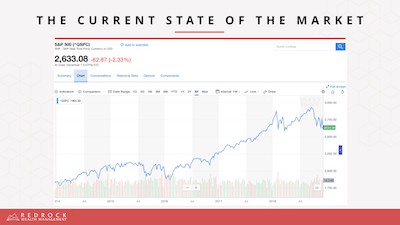
Currently, we’re well off the highs as you can see. In terms of the stock markets long-term march upwards, our current valuation is nothing abnormal. We’re experiencing a lot of volatility right now—a lot of ups and many downs. We’re going to talk about volatility here in a second, but in the grand scheme of things, it’s not that crazy of a chart.
To be honest with you these types of pullbacks—you can call it a correction or a bear market it depends on who you are—but these types of pullbacks are just par for the course. This recent market drop doesn’t even hit our radar here as something to be alarmed about.
These stock market drops well, they’re very healthy and I kind of jokingly tell people well imagine if the S&P 500 didn’t go up to almost 3,000! Imagine we’re at the high point now! You’d probably feel a lot better because we had never hit that high mark.
Keep in mind that the S&P 500 is only 500 stocks. It’s it’s not your portfolio, it’s not internationally diversified, and it doesn’t even have small companies in it. It’s 500 stocks that are all pretty much large companies and maybe leaning a little bit more towards the gross side of the equation, but these are 500 big companies.
Are your expectations in line with reality?
The question I have for you is “are your expectations in line with reality?” Relative to bull and bear markets throughout history, as you can see, we’ve had a hundred and twenty-three corrections, and that’s going back to 1900 when we started tracking these things.
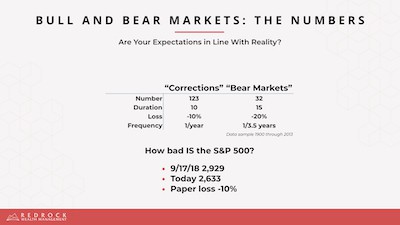
A correction—which is where we’re at today—is a loss of about 10% or so.
A bear market is something that’s 20% down or worse generally speaking.
As you can see here, we have a correction every year on average! It’s very very typical for us to drop 10% every 12 months or so.
A bear market is going to last longer than a correction (about 15 months in duration). We have one of those every three to four years. So these things are very healthy. It’s just average, just par for the course.
To be honest with you it’s very odd that we hadn’t had a correction per year since the Great Recession back in 2008 (and that was our last bear market as well). We should have had two or three bear markets since, and we haven’t had those which is odd.
Well, we were certainly due for a correction! We aren’t trying to get into this prediction game of what’s going to happen next—it just doesn’t work. However, if you look at our numbers today, we’re down about 10% from the high that was set back in the middle of September.
You can see the S&P 500 has gone from about 2,900 to about 2,600. We’re down about 10% which puts us in correction territory. Looking through the history of the stock market going back to 1926, you can see we have these massive bull markets represented by these big blue boxes. They’re about two and a half to 3 years in length versus a bear market which is less than a year in length.
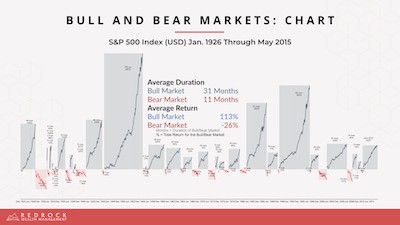
You can also see the returns of both bull and bear markets. We’re going to have on average a positive 113% return versus a bear market which is a -26% return.
The thing that you have to keep in mind is that these massive bull markets are punctuated by temporary bear markets. You can see the red boxes underneath the line representing bear markets throughout history.
We must live through these brief punctuations in our long-term trek upwards, or it’s not investing in the stock market! Bear markets happen, and whether it happens for this reason or that reason who knows? However, throughout history, as you can see here, we’ve had massive bull markets and temporary bear markets.
Since bear markets are guaranteed, make sure you’re preparing for them effectively.
Stock market volatility
One thing that is interesting to me right now—and we’ve had a few questions on this lately—is volatility. As you can see this is the VIX which is a measure of volatility. This is a five-year chart again, and as you can see we’re at 23 in the grand scheme of things.
Is it way above average? No. Is it above average? Yes.
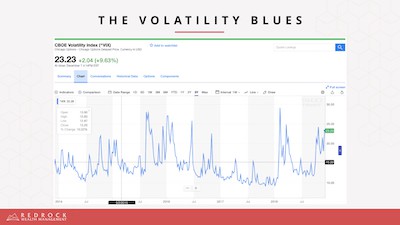
We’ve also had other periods in time of excessive volatility. As you can see they don’t last too long. They’re kind of like the short punctuation bear markets bring to a long-term bull market.
Recently we’ve seen market drops of 600 points and then rises the next day of 500 points.
The stock market is all over the place!
Can we take anything away from that knowledge? No. It’s just volatility in the market, and we have to get used to it. However, the volatility is again, par for the course. It’s very normal going back throughout history to have periods of excessive volatility and lower volatility because that’s just stock market investing!
If investing in the stock market was easy everybody would do it. Everybody would then have a return closer to two or three percent because it would be a nice calm, smooth ride. But the fact volatility is the reason that the stock market has higher returns.
Going back to the 1920’s you’ve got a stock market return of about nine to ten percent depending on what index you look at. The reason that we have higher returns is because of the volatility shown in the chart here.
If we didn’t have the volatility, we wouldn’t have the higher returns you may need to accomplish your money goals. So remember, to wish away the risk is to wish away the reward!
Returns come with patience
We’ve had a few calls lately what’s going on with the market? Should I get out? should I get in? Granted, most of those calls are not from our current clientele. They’ve been educated and trained along the way, and we don’t have those sorts of fears generally speaking. But we’ve had some calls from people interested in working with us and wanting our take on the marketplace.
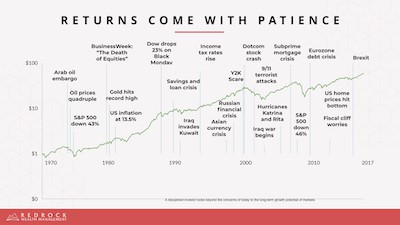
The truth is returns come with patience, and what I’m not seeing right now is patience! Jeremy and I kind of joke around in the office here about how this whole bull market since 2008 has created kind of what we would call a “zombie investor mentality.” Everybody has this mentality that the stock market is just going to go up and up forever!
The reality is we must have bear markets! We need volatility in the stock market.
As you can see it doesn’t matter what’s on the news. I’ve been doing this for 23 years and I’ve heard so many reasons to get out of the market. It’s bird flu. It’s SARS or the pig virus or unrest in the Middle East.
There’s always something to be worried about. Maybe it’s China’s economy or Brexit. It’s never-ending.
In fact, Brexit is one of the most recent concerns that we hear a lot about. People are very concerned about Brexit, but the truth is all of those concerns are baked into the cake because information today travels at the speed of the internet! It’s in your phone in seconds, and you can trade on it with the push of a button.
So all of those expectations for future events—whether it’s Brexit or the economy—are already reflected in stock prices. Therefore, there’s nothing you can do to trade on or take advantage of those.
Remember, returns come with patience, and that’s one of the things that we don’t see today with most investors is patience. I would highly encourage you to absorb this information take a deep breath! Take a step back, and realize that there’s always going to be a reason not to invest.
Risk lessens with time
The truth is your risk is drops over time. This goes back to the whole “be patient” story I was just referencing.
In the following chart you’ll see three different portfolios from really aggressive 100% stocks to somewhat aggressive (or growth-oriented) 70% stocks, to kind of conservative 40% stock blended with 60% bonds.
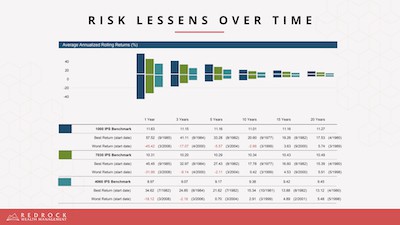
As you look over time, you’ll see your one-year returns through your 20-year returns. With a conservative portfolio, you’ve got a range of -18% to +24% for a one year period. For a growth-oriented portfolio your returns range from -32% to +45%.
As you spread this out over time your risk is reduced. Take for example 5 years. It’s the minimum that anybody should be invested in the stock market for. If you’re not invested for five years, get out of the stock markets! There’s just no purpose!
I use this analogy. My grandmother (God rest her soul) passed a few years back at 98.
She always had five more years. There was never a day where she said I’m going to pass on this day, so put me all in cash.
She was always thinking five more years. One of our clients just passed a couple of months ago, and she was 107 years old!
There’s always going to be a reason not to invest—or to think short term—but I want to caution you on that thinking. As you invest longer and longer, the returns get more and more concise, and there’s less variation.
The same can be said for clients who start when the market is up versus the market being down 20% (and that could happen all within the period of a quarter). Your returns are going to vary widely from one client to the next; however, as you extend out focus on the big picture 15 years and 20 years down the road, those returns get into this more narrow range.
So again, have patience! Investing over time is going to reduce the risk you experience and give you a much higher degree of accomplishment of your financial goals.
Why invest in international stocks?
Another question we get on a fairly often basis now—which I find a little bit funny—is why are we in international stocks? We should get out of international some people say.
Ironically, Vanguard increased their allocation to international equities last year and here we are in a horrible international market. Then again, Vanguard would never time the market and I’m positive they hve the same outlook as I do.
We’ve actually had those phone calls where clients will say, why are we in international? It’s horrible! It’s dragging down my portfolio returns.
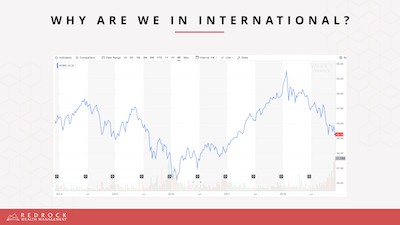
The truth is yes! If you look at the high point—which was about the beginning of the year—to the current point we’re down about 20% in the international market. So that’s twice as bad as the US markets.
I’m going to go through a few lines of thinking on this right now, but at the end of the day when you look at your portfolio returns, you’re going to see bigger losses than if we were all in US stocks. That’s okay. That doesn’t bother me because we’re going to go over why we diversify
Diversifying smooths out the bumps in your investment portfolio
Diversifying is going to smooth out the bumps in your portfolio. Any security or asset class you have is going to be much more volatile than the portfolio as a whole.
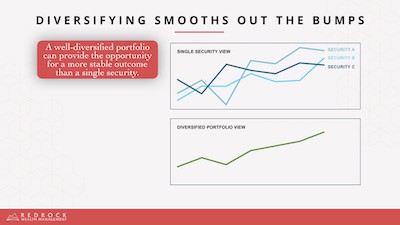
So International equities have an excellent purpose because they’re going to help smooth out the bumps of your overall portfolio. I can I can think of times back in the mid-2000s and so forth where international was crushing the United States markets. You certainly don’t want to be out of foreign stocks when it’s doing that right?
So we do need to have an exposure to international. Typically, we’re looking at about a third of your equity portion that’s going to be in international.
If for example, international went up and down the same pace that US stocks did and they were highly correlated and did go up and down at the same rate you would be crashing at the same time as well.
You would be going up at the same time which would defeat the purpose of diversification. Unfortunately, being diversified means that a financial advisor like myself means we’re always going to have to say we’re sorry.
When you come in, and we do your portfolio reviews, you’re going to see something in your portfolio that is underperforming. Whether it didn’t go up as much or it’s just getting crushed, something will be underperforming.
That means we’re going to have to say we’re sorry every single time we meet. We diversify, and we diversify into what we call negatively correlated investments or asset classes, or asset classes that do not correlate at all.
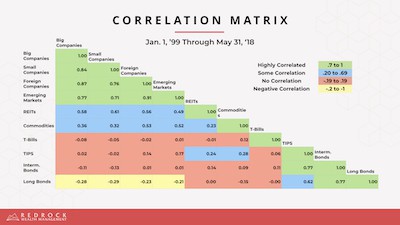
Correlation matrix 101
If you look at how different asset classes relate to each other, what you’ll see is, for example, big companies have a negative correlation to long-term bonds or no correlation to other types of shorter-term bonds. So we (as your financial advisor) package these two asset classes—stocks and bonds—in your portfolio in a proportion that is comfortable for you—a proportion that is going to accomplish your goals within your financial plan for your retirement.
Some advisors will say “hey, just take this test.” Take this quiz. Let me gauge your risk tolerance and then look . . . here’s your portfolio. It magically says 50/50. 50% stocks and 50% bonds. We don’t believe that that tells the full story.
We will do a risk tolerance questionnaire with you. We’ve have done that with every single person who works with us.
However, what’s important is looking at your risk capacity and your risk required. So those are the three things that we use to determine the relationship of stocks to bonds or the amounts of stocks to bonds in your portfolio.
#1 Your risk tolerance, which is that quiz that everybody can take online. You can take one called Riskalyze at redrockwealth.com right now.
#2 You must also look at your risk capacity. Risk capacity is how much risk can you afford to take? If we have adverse events in the market, it won’t knock you off your retirement path or your financial goals path. How much risk can you afford to take? We want to make sure the bad times in the market will not dissuade you from buying that car or that yacht or whatever you want in retirement. We want to make sure you can still accomplish those goals.
#3 Finally your risk required is how much risk you need to take. For example, if your financial goals are so lofty you may need to take more risk to accomplish those goals. Conversely, if your financial goals are very mild and mellow, then you don’t need to take all that risk.
Those are the three essential components of your asset allocation plan. We might tell you to be more conservative even if you have a high risk tolerance.
When we build your portfolio’s stocks and bonds ratio, we create these portfolios for you. These things are the most critical parts of your asset allocation decision.
Then we look at how does emerging markets correlate with t-bills and such. Those asset classes are negatively correlated. How do commodities correlate with tips or treasury inflation-protected securities?
So we look at all these things then we package them in different ratios or different allocations in your overall portfolio to get you appropriately diversified, with a focus on your overall risk tolerance, risk capacity, and risk required.
What we want to do is build in these negatively and no-correlation investments in a way that will smooth out the overall portfolio ride for you.
Global diversification enhances investment returns over time
Another reason we have international equities in your portfolio is that quite frankly they have higher returns over long periods of time. If you look throughout history—this chart only goes back to 1969—the returns are even more significant.
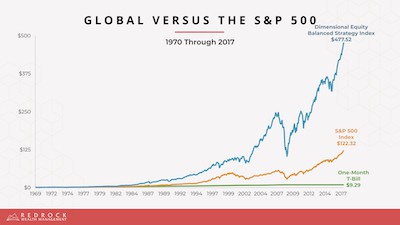
As you look at a global balanced strategy, you’ve got a return that’s about four times greater than the US market. That’s just another big reason that this concept of ditching international hits me upside the head and says “hey, why are you worried about International”?
I know it’s down twice as much as the US markets this year, but it’s there for a reason! It’s there to diversify; it’s also because it’ll hopefully give you higher long-term returns as part of a globally balanced portfolio.
By allocating into the international markets, you also tend to smooth out a rough investing ride.
What you can see here is that bouncy orange line all over the place. That’s the S&P 500. The blue background is a globally diversified portfolio.
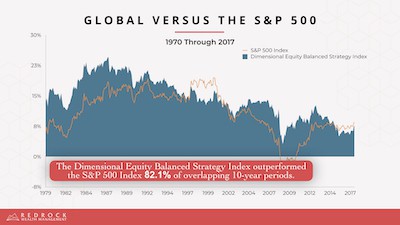
As you can see a globally diversified portfolio is going to outperform the S&P 500 about 80% of the time. It also has a little bit smoother of a ride than just investment in US equities on their own.
So you have a smoother ride by adding international equities. International equities have had a higher return over the long-term. Hence, we use international equities for diversification.
However, what about periods like 2018 when the US is crushing international equities? If you look at the periods in time where globally diversified underperformed US equities, they’re minimal.
Below is a returns matrix, but it’s not just the returns. It’s the return of globally diversified equities over the S&P 500.
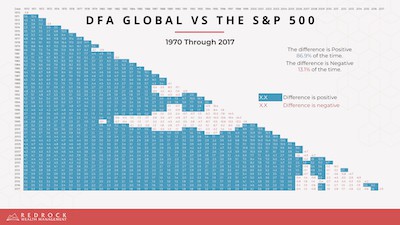
How you read this is you pick a date range, for example starting in 1986. Then you choose an ending point, say 2001. How were the results from 1986 to 2001? Globally Diversified beat the S&P 500 by about a half a percent.
When globally diversified doesn’t beat the US market are these pockets of red here. Obviously, they do exist. There are periods in time when being in the US only is going to be a boost to your portfolio returns and international equity performance will drag it down.
By the way, this is one of those years (2018)! However, generally speaking, you can see over the long-term global diversification wins. It’s about 86 percent of the time (on this particular date sample) that you’re going to have a better investment result by being globally diversified.
So that’s another reason that we stay internationally diversified even if it’s uncomfortable and yes, we’re going to say it: “we are sorry international really stinks this year!”
Keep in mind we have asset classes in your portfolio. We have commodities, real estate investment trusts, big companies, small companies, value companies, growth companies, international companies, emerging markets. When those asset classes are out of favor like international is right now, we’re looking for opportunities actually to buy more shares at lower prices.
I look at it like this. If I’m going to the store and tuna fish is a buck a can yeah, I might pick up a few cans. However, if it’s 50 cents a can next week, it went on sale! I’m going to pick up twice as much! So I’m going to go ahead and put it in my cupboard, and I’m going to eat it as I see fit. The point is I want to buy tuna fish cheap!
I want to buy things while they’re cheap—I don’t want to get out of them! You’re thinking it’s counterintuitive to conventional wisdom which says “get out now it’s going down.” You’re right; it’s counterintuitive.
We want to buy things while they’re cheap. We look at your portfolio monthly to do this. We don’t do it yearly because I find that it’s just not enough. It doesn’t capture enough of the potential that market volatility has to offer in terms of rebalancing.
So we do this monthly. We’ll look at February and find maybe US stocks are up and we’ve got bonds that are down. We’ll sell some US stocks and buy some bonds.
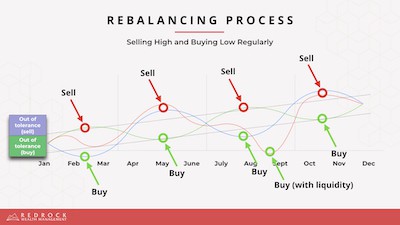
Then maybe in May, it’s the opposite. Bonds are up, and international is up. So we might sell some bonds and international equities, then buy some US stocks.
Then maybe we may have an opportunity in September where we don’t necessarily sell anything because nothing’s out of tolerance. However, we might buy something with cash if commodities are down and we’ve got cash sitting on the sidelines.
We might put that cash to work because it’s an opportunity to buy cheap, and that’s what we want to do. That’s really how you end up making money in the stock market—by being a long-term investor, but taking these opportunities as well to be selling high little bits and pieces of your portfolio, and buying low other pieces.
How do we do that you might ask? Well, it’s a lot of technology. We have different tolerance bands or ranges on these asset classes.
So for example, if US equities are over 20% of what they’re allocated in your portfolio, we would look at that and say it’s time to sell off a little bit of US equities. If they’re under by 20%, it’s time to buy more.
Those aren’t the exact numbers we use. I don’t want to give those out on a webinar for the public because I don’t want our trade secrets getting out there.
Then we might look to see if commodities have dropped 10% from target. We’d look at buying some of those asset classes.
So we have different bands or tolerances that we put into practice here. We have a lot of technology that helps us execute this process.
Your mutual fund performance rankings
So one of the big questions I get is, “Okay, so the market stinks and I get it. It’s very frustrating the market stinks. But you know, are we in the right stuff? Should we change something?”
My answer is I want to show you this fi 360 report. For those of you who work with us, you’ll know that we review these reports every quarter whether you’re in the office or not.
This is what I call the actual two-by-fours of your portfolio. These (your mutual funds and other investments) are the building blocks of your investment portfolio house.
We talked about how big is that house? How many rooms do you have? And so forth.
Well, the house may be a certain size and that’s your ratio of stocks to bonds. And how many rooms you have? That’s how much is an international versus US equities versus commodities versus bonds and on and on.
Then we look at how do we build the house? These are the two-by-fours. . . the building blocks.
I want to emphasize we go through this very robust process. It’s a software process called fi360. The data comes in from Morningstar, and fi360 puts an 11 step test on every single mutual fund out there in the universe.
Fi360 then grades each mutual fund amongst their peer groups. As you can see, we’ve got a certain number of peers for each fund. That means that we’re comparing apples to apples.
Take notice of the mutual fund peer groups. Notice how they drop over the time periods? Mutual fund survivorship bias, unfortunately, makes our fund lineup appear worse than it is in reality. Learn more about mutual fund survivorship bias here.
Typically there are some limitations to this. Generally, we’re comparing apples to apples. For example a large cap mutual fund to another large cap mutual fund. They’re put through this 11 step process which is very independent.
In fact, if you read the book I wrote a couple years back, you’ll recall there’s a company called Macrorisk Analytics which reviewed fi360. They reported the fi360 process is actually quite good at being more predictive of consistency in the future.
The Morningstar rating is just past performance. I prefer these 11 tests because they’re not all performance like Morningstar and some others like the Forbes best funds and so forth. These tests are more robust like fiduciary scores and is the fund big enough? Is it style drifting?
The fi360 process also looks at the expense ratio, and is the manager adding value? Is there too much risk for unit of return?
It also says, “Okay. What’s the performance relative to peers?” It then ranks them against all the peers as I mentioned and produces this report. It’s like golf, it gives us this nice color coded chart where the lower the score the better!
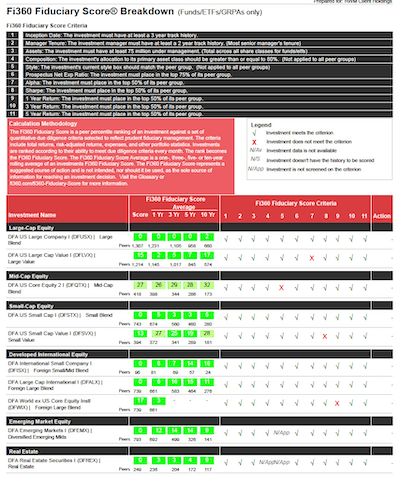
What you’re looking at here is you’ve got these funds in your portfolio in some form or fashion if you work with us. We’ve got funds that have incredibly low scores (like golf that’s a good thing!).
I would never expect to see all these zeros. The reason I wouldn’t expect to see them is because we’re a passive investment firm. We’re not an active investment firm that’s going to go out and pick mutual funds where the manager is buying selling, timing and trading, and trying to duck and dodge around the market.
We’re not active in that sense. We are passive which means there’s always going to be some active managers out there who do better than our passive funds do. They just don’t keep that performance consistently, but that’s a whole other webinar.
I would expect our passive funds to perform at more like the 20th or 30th percentile relative to the mutual funds out there. The fact that we see a lot of zeros and two’s and 15’s in here is just very it boggles my mind in a good way. It just means that we’re doing the right thing.
So the point that I’m trying to make here is that your portfolio—the two-by-fours of your house—well we can’t get much more solid two-by-fours in your house. So it’s not the funds that you have, and it’s not the allocation that you have that’s causing the frustration or anxiety.
It’s just frankly a state of the market, which is just par for the course. It’s normal again, big bull markets will be punctuated by temporary bear markets throughout your lifetime. And those corrections are going to come about once a year. So it’s just one of those things that you need to be used to.
Does any of this even matter?
I want to pose a question to you. Does any of this even matter? The fact is everybody’s got a different stage of life, a different plan, a different goal.
We look at people in three different life phases regarding their finances and planning. We’ve got accumulation investors, which are those investors who are saving for retirement.
They don’t need the money. They’re putting it away and investing it for the future.
Accumulation investors may be 55 or 60 or younger. So they’ve got time on their side. They can be more aggressive, and guess what? Bad markets are a good thing!
Personally, it’s I love it when people say “Hey, by the way, I just upped my 401k because the market went down!”
Unfortunately, that’s the opposite of what most people do, and it drives me a little batty! We’ve had people call us and say “I stopped putting money into the market because it wasn’t doing well!” That’s just the absolute reverse thinking of what you should be doing!
As the market drops, you should be buying MORE because it’s the same can of tuna. You’re just getting twice as much for example. You’re buying these same stocks that you were before just cheaper.
You drive down any Main Street in the United States or around the world. You see a public company, you’re buying the same shares of that company that you just drove by! You simply get them on sale.
So if you’re an accumulation investor, bad markets are a great thing. You want the market to drop! Also for our 401K clients, especially this is when you need to put everything into your 401k and be buying as the markets drop. Put your blinders on, don’t worry about it because you’re an accumulation investor!
Now if your transition investor, that means that you’re probably five years from retirement or something along those lines. That means you’ve got a little bit more anxiety a little bit more concern because now you’re about ready to switch from saving to spending.
If you’re a transition phase investor, you need to be very careful with your retirement planning or investment planning. You might need to change your portfolio!
If you’re an aggressive accumulation investor and have 80% stocks as you hit transition age, maybe 70% or 60% is more appropriate. I don’t know everybody’s different, but you need to be very very careful. You also need to start thinking “Hey, I’m going to be a decumulation investor or a retiree investor pretty quick.
A decumulation investor is living off of their investment portfolio. You’re living off of liquidations from it; you’re living off of your Social Security at some point, you’re living off of a pension possibly. You’re not saving, however, and this is where the rubber meets the road! And this is most of our clientele, most of you on this webinar today.
What you need to know is that we plan for these bear markets. We expect these corrections.
Every one of our clients has (generally speaking) around a year to two years of cash flow set aside. So what’s the worst thing that can happen to you? If you’re a decumulation investor, the worst thing that can happen is the market goes down.
In bad markets, you typically have to sell shares for cash flow to live, and you’re going to sell more shares at lower prices. This is potentially disastrous!
We build all of that into our plans, and in our retirement plans with you. However, that’s (selling in a bad market) what we want to avoid at all costs, and that’s why you’re going to have what we call our “bear bucket” or our cash reserves.
So when the market drops guess what? You turn into an accumulation investor again with your portfolio in a sense, because we are rebalancing remember when the market drops. We’re going to be buying things lower and selling them higher.
However, you’re also going to need cash flow to live. We’re going to send you cash flows (or you’re going to take them out of) from your cash reserves. Whether that’s at a bank, whether it’s in some bonds or CDs that have no penalties, or whether it’s in money markets or short-term treasury inflation-protected securities. No matter what it’s in, that’s where your cash flow is going to come from if you’re a decumulation investor.
That should allow you to sleep at night, because not only are you not selling stocks in a bad market, but we’re rebalancing into them because they dropped. In a sense, this turns you into an accumulation investor again, and hopefully makes you feel a little young again!
I want you to sleep better at night because the worst thing would be to sell more shares of stocks or stock Investments as they drop. We want to do the opposite, and we want to put you on a path that allows you to do that.
Some final parting thoughts. I want you to remember you don’t own what you see on TV. You’re trained to think “Oh my gosh the markets down 20%; I’m down 20%.” It’s not the case.
You don’t you don’t own the market that you see on TV! You don’t own 500 stocks. Our clients own over 13,000 companies across 43 countries. They also hold well over a thousand different bond issues in their mutual funds—sometimes CDs or sometimes structured notes—things like that.
You’ve also got things that the government cannot print such as commodities and real estate. It’s tough to get more diversified than our clients are, so please remember you don’t own what you see on TV. Just because the stock market’s down 20% doesn’t mean you’re down 20%. You might be down half of that or some fraction thereof.
You might be down three-quarters of that drop. You might be down the full 20% if you’re fully allocated to stocks. I don’t know, but you don’t own the market you see on TV. So please put that in the back your mind.
Also keep in mind that all of our clients—well most of our clients, there are some that are highly aggressive—but most of our clients own some bonds. If you go back to the correlation charts, you’ll see that bonds have that negative correlation or no correlation to the stock market.
So keep in mind that you own some bonds. Those bonds might be doing very well! The bond portfolio might be going up while your stock portfolio is going down.
However, it doesn’t always work that way. Back in 2008 everything dropped at the same time, and everything became correlated. Generally speaking, you’re going to have that diversification.
So you do own bonds, and remember you don’t own what you see on TV. Your returns are going to vary widely from what the stock market returns.
Finally, focus on what you can control. We can control fees and expenses with your mutual funds—the two-by-fours of your investment house.
We can control how we put them in your portfolio. We can manage the allocation of what we put in your portfolio, specifically how much in stocks and bonds. We can control your retirement plan and how much you’re spending and how much you’re saving and what you want to do.
When you retire, we can control those things. We cannot control the stock market. It’s just going to do what it does, and again to wish away the risk if you want just a nice smooth ride means that you won’t have the returns you need to accomplish your goals. So we need the volatility. We need the bear markets.
We need to shake the apple tree. That’s a little joke that I have. I tell this story in my book where I grew up in a place called Apple Valley, California. And yes, there were a lot of apple trees. It just seemed to be what they did in Apple Valley. For those of you who drive through California—through the high desert—that’s around the Victorville/Hesperia area before you get to San Bernardino.
So I grew up there, and I remember sitting out in the backyard doing work with my grandpa. I would shake the apple trees, and these rotten apples would fall off the tree. I laughed, and it left us all the good apples on the tree.
So then we knew when we go pick an apple, we just pick the good ones because the bad ones have already fallen off. That’s kind of an analogy for the stock market.
I’m not going to say I enjoy bad markets. Obviously I wish you would always go up. However, in a sense, I enjoy it because it shakes the bad apples off the tree.
It gets rid of the investors that aren’t long-term like you are. Again, if you’re not long-term, if you’re not thinking at least five years into the future, you need to get out of the stock market.
You have to be thinking five years into the future or more. Generally we want to talk about a lifetime of investment, you know, 20 30 40 years throughout your retirement and so forth.
So shaking the apple tree gets rid of the bad apples which allows the market to continue back upwards on that bull market run. These periods in time, they’re frustrating and cause some anxiety. However, if you’re doing it right and if you have the right perspective, these things shouldn’t be too worrisome.
In closing
Hopefully, you’ve enjoyed a lot of this information. Hopefully it’s opened your eyes a little bit, and you have a better perspective on what to expect for your portfolio and the stock market.
Hopefully, it’s kind of “freeing” that some of the things shouldn’t be too worrisome. We are in a correction right now, and it’s not that abnormal.
I want to thank you very much for your time. I really enjoyed doing this webinar for you. I’m going to be doing a lot more. I haven’t done these since before to October 1st, 2017. I just kind of took a break from things after that. For those of you who know, it was just kind of a traumatic day for everybody here in Las Vegas. Keep an eye on your inbox though, you will be seeing more and more of these webinars in 2019.